All people, companies and projects shown are synthetic Rillsoft sample data – from the shipped industry packages or, where stated, from a test project.
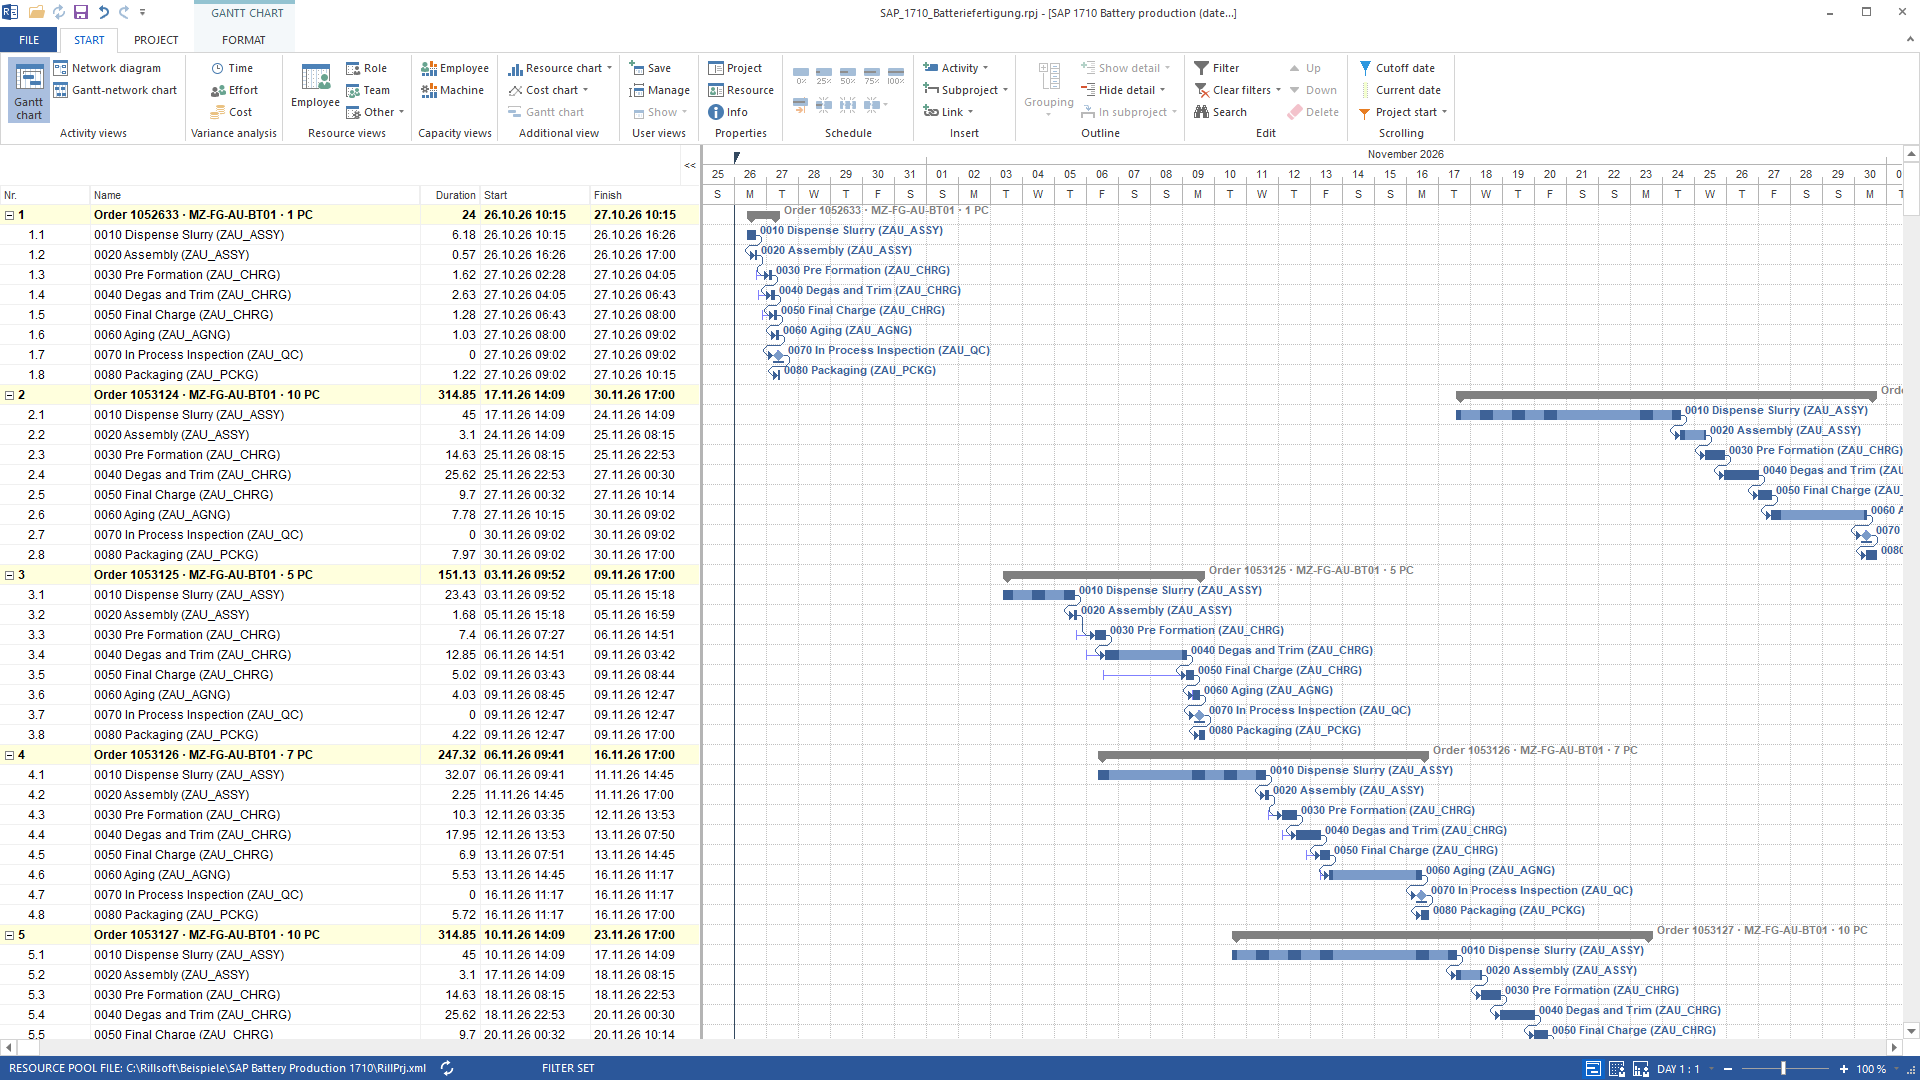
Six production orders result in 48 operations. Battery assembly needs 169.1 hours against 234 hours of supply, yet has a 21.7-hour shortfall: SAP schedules operations on the same work center at the same time.
Source data and preparation#
Prerequisites are Connect SAP and Rillsoft in one AI client and the preparation in Reproduce the Rillsoft SAP demo step by step.
AI and you together: choose production or maintenance. Confirm the plant, work centres, source period and any date shift; for production, also establish whether lines are interchangeable. Show the mapping before creating anything. Use a separate Rillsoft instance with a new, empty project and a copy of the resource pool. Obtain specific confirmation before discarding an open project or saving a file.
Production: machine types and occupied time#
| SAP data | Rillsoft mapping |
|---|---|
| Production order / operation | Subproject / task with SAP identifiers in the notes |
Work centre, machine capacity 001 | Machine type on the task; number of machines in the pool from CapacityNumberOfCapacities |
| Setup, machine time, labour time, quantity | Battery case: net time = setup + quantity × (machine + labour); first verify MIN units |
| Evenly distributed break | Occupied time = net time × shift length ÷ (shift length − break), rounded to whole minutes; no additional fixed break window |
| Shift | Calendar on the task; use the same calendar as the project calendar for that machine type’s capacity report |
| Quality inspection with zero duration | Milestone without a machine type, at the predecessor’s finish |
| Order sequence | Finish-to-start dependencies; investigate every rejection |
Sequence: read pool path and original view → copy pool → rillsoft_project_create without a name → select pool copy → create master data → save and close pool editing → name the project. Set timeStepMinutes: 1, duration and effort units minute, mode deadline_driven. Naming the new project too early prevents switching pools. Use IDs returned by create calls; do not guess them from an unsaved catalogue.
Read capacity with rillsoft_view_state_apply, view machine_capacity, grouping ["machine_role"], display: "absolute", capacity: true and the agreed time filter. Then call rillsoft_timescale_apply with unit: "hour" and rillsoft_analysis_report_get. For different shifts, read one report per shift model, taking each machine type from its matching report. Verify that changing the project calendar leaves task dates unchanged. Divide report values in minutes by 60 for hours.
Rillsoft Project screenshots#
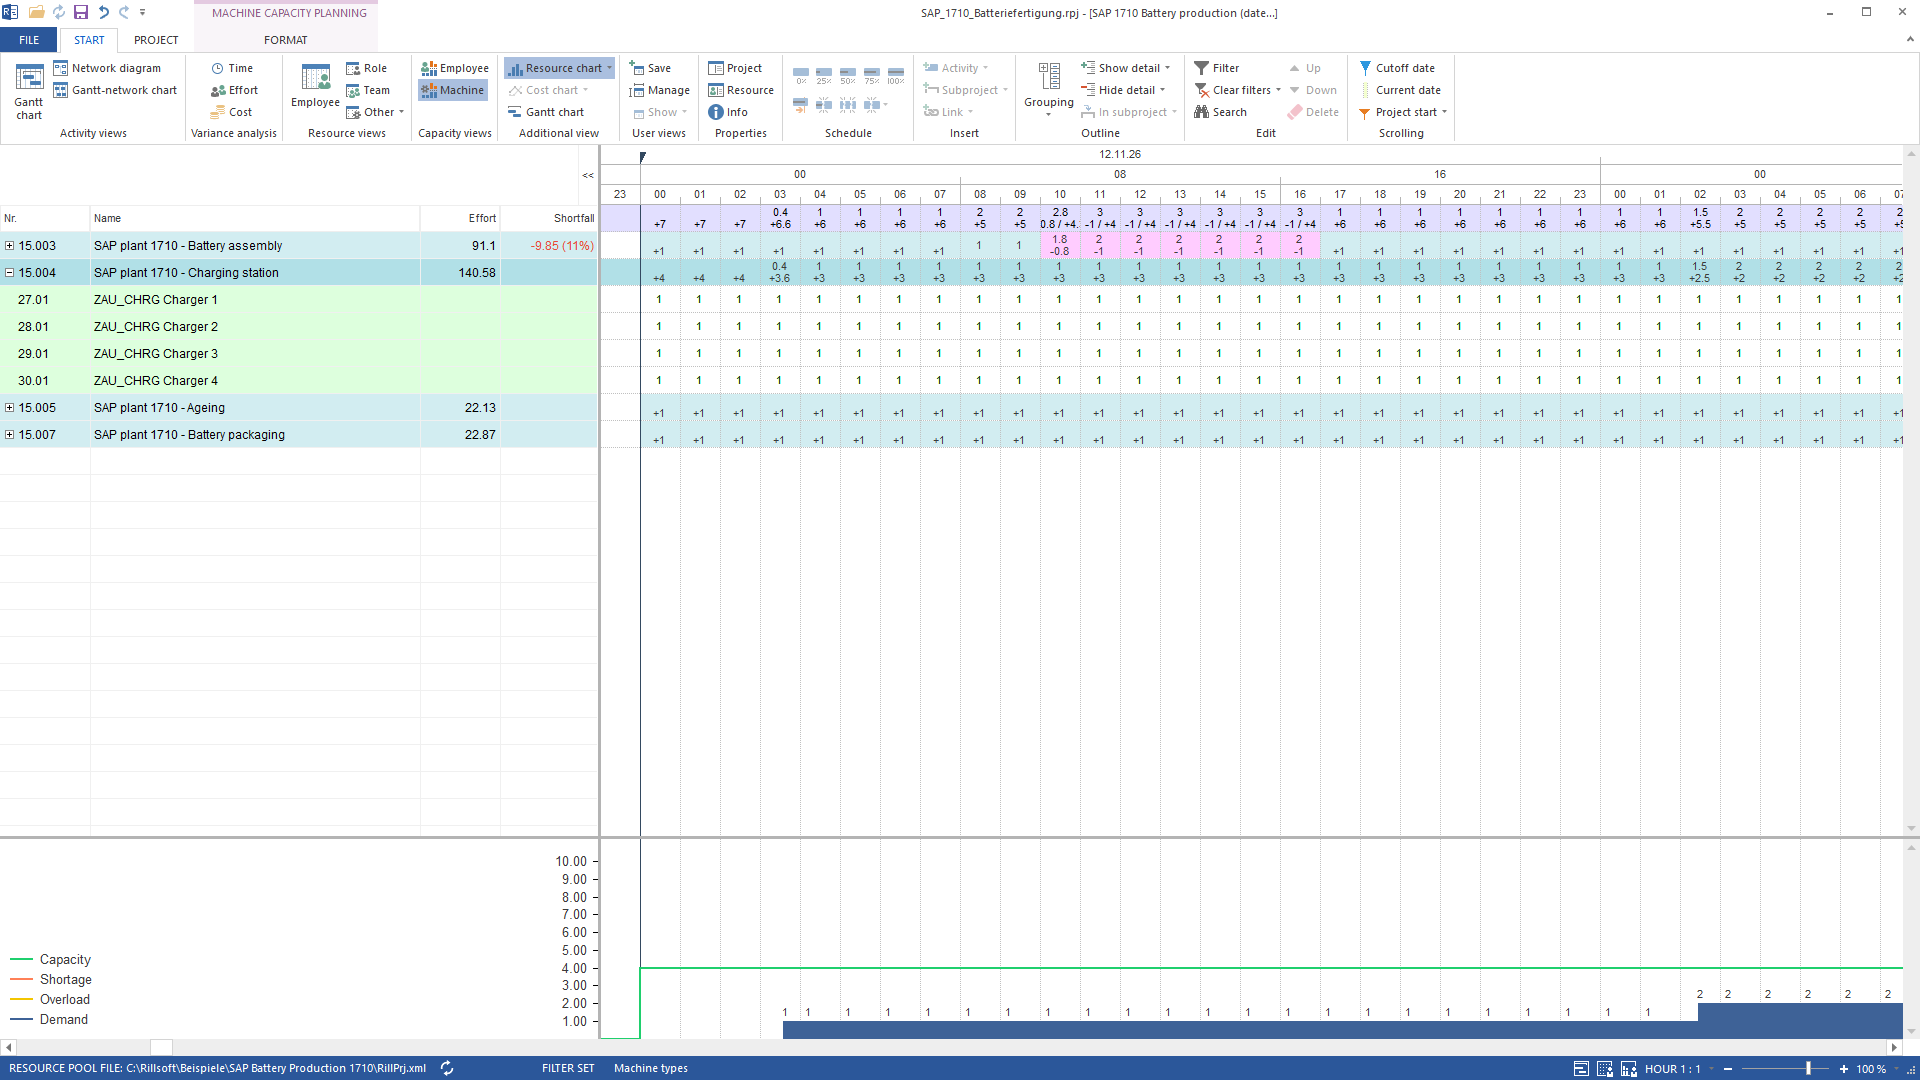
Screenshots taken on 23 Oct 2026 from Rillsoft Project 10.0.626 (the test build), client area 1920 × 1080, effort in hours, time filter as stated; the numbers in the image belong to that view and may differ from the report totals in the table – each caption states where its number comes from.


Reference results and timescale#
These figures refer to the 20 October 2026 retrieval. SAP may change its sandbox. Reference values are a comparison, never numbers for the AI to substitute into a different run.
| Check | Battery manufacturing: machines |
|---|---|
| Plant / period | 1710; SAP February–March 2023, shifted +193 weeks → 26 Oct–30 Nov 2026 |
| Orders / operations | 6 / 48 |
| Net reconciliation SAP / Rillsoft | 367.50 / 367.48 h duration |
| Dependencies | 42 |
| Occupied time or demand / supply | Assembly 169.1 / 234 h |
| Shortfall: hour / day / week | Assembly 21.7 / 21.7 / 21.7 h |
| Peak concurrent demand | Charging at most 2 of 4 devices |
| Date comparison | At most 2 minutes difference |
For batteries, the capacity filter runs from 26 October 2026 00:00 to 1 December 2026 00:00. Day shift works Monday–Friday 08:00–17:00; charging Monday–Friday 00:00–24:00.
Shortfall = sum of positive differences between demand and supply in each time bucket. Day and week allow spare time within their bucket to offset demand. For assembly the shortfall stays at 21.7 h on the hourly, daily and weekly scale: on the affected days the single assembly machine has no spare time that could offset the overlap. In the maintenance example, by contrast, the hourly gap disappears in the daily total. Start with hours for detailed scheduling, then add day/week for an overview. The earlier line 26XR1 run on 20 October 2026 also showed 1,072 / 1,029 / 882 h for the same assembly on hourly/daily/weekly scales. Spare capacity in a weekly total does not establish a conflict-free schedule.
Reconcile before reporting and restore the starting state#
Compare task, order and dependency counts and net time or net work against SAP. Also check that the start and finish of every subproject equal the earliest start and latest finish of its tasks. Where Rillsoft duration includes a break allowance, reverse that factor per task before comparing net values. Document rounding and tolerance before judging the result: less than 0.05 h difference for batteries, at most 1.2 h for the maintenance reference. An excess or rejected dependency requires a discrepancy message, not a completed success report. Restore the view and original pool and verify restoration. Save project/pool files only to the confirmed destination.
Frequently asked questions#
One machine type per line or a shared type?#
Only interchangeable machines should share a type. In the additional four-line run with 1,176 operations, combined capacity reduced assembly shortfall from 45,076 to 44,780 hours. Interchangeability does not automatically remove simultaneous overload.
Reproduce and compare#
Reproduce the Rillsoft SAP demo step by step · Check SAP maintenance workforce capacity with AI
Sources and trademarks#
Demo evidence: Rillsoft runs of 20 October 2026 for battery manufacturing, maintenance in plant 1010, line 26XR1 and four lines, each using Rillsoft Project 10.0.626. This guide was compiled from that evidence on 22 October 2026; the figures were confirmed on 24 October 2026 in the free prompt run (German and English, through to the report).
This example uses the MCP Gateway in SAP Integration Suite, which SAP describes as its intended access path for external AI agents connecting to SAP systems. The SAP API Policy, particularly section 2.2.2, and the terms and access restrictions of the services used still apply. The demo only reads sandbox data and does not write changes back to SAP.
SAP, SAP S/4HANA, SAP BTP and SAP Integration Suite are trademarks or registered trademarks of SAP SE or its affiliates in Germany and in other countries. This guide is published by Rillsoft GmbH and does not represent SAP certification or partnership.
Back to Connect Rillsoft Project to SAP.
Reproduce it yourself
Get started- Product version
- Rillsoft Project 10.0.626; SAP Integration Suite Trial