All people, companies and projects shown are synthetic Rillsoft sample data – from the shipped industry packages or, where stated, from a test project.
The prompt
Create a management dashboard for a period from Rillsoft Project with the roles chapter. First ask me for project or portfolio, period and time unit, and propose a time scale for the trend. The chapter has four parts with the same period: A stacked columns of role utilisation per interval, B a pie chart of the share per role, C columns with demand and supply per role from the capacity comparison, and D demand and supply per interval over time, with the shortfall from daily values. All four parts belong to it, the pie chart included; leave none out and list at the end which charts the report contains. Check that the totals agree. Provide the complete report as a downloadable PDF in A4 landscape, with readable charts, complete tables and clean page breaks. Also give three key findings with figures in the chat. If you cannot create a PDF, provide a print-ready HTML file to save as PDF. Link only to files you have actually created.Changes the project (one undo step)
Show the detailed prompt
Create a management dashboard from Rillsoft Project with the roles chapter (job roles).
First ask me for:
- Scope: which project or portfolio (name the open one and let me confirm),
- Period: start and end – it applies to all parts,
- Time unit: hours or person-days (name the one set in the program),
- Time scale for the trend: propose one (at most about 30 columns).
Data:
- Role utilisation, flat by role, absolute display, time filter on the period, time scale as confirmed: one report for the trend and the shares.
- Staff capacity comparison, flat by role, absolute with capacity, the same time filter, day scale: demand, supply and shortfall from daily values per role; the same daily values summed per interval of the time scale for the trend of demand and supply.
- Before drawing, check that total effort and effort per role are the same in both views; if not, name the difference instead of the chapter.
- Do not recalculate anything from the plan.
Dashboard:
1. Header with the title “Management dashboard”, chapter, scope, period, unit, as-of date and source.
2. Key findings: three to five sentences, each with a figure – total effort and utilisation, busiest interval, largest role with its share, shortfalls on individual days with the month.
3. Part A – trend: stacked columns per interval, the total above each column, no capacity line.
4. Part B – shares: pie chart, largest slice first, percentages adding up to exactly 100, legend with hours and share.
5. Part C – demand and supply per role: two columns per role, shortfall with symbol, text and month; below it a table of the shortfalls.
6. Part D – demand and supply over time: two columns per interval on one axis, above them the shortfall on individual days with symbol and hours; below it a chart of its own for every role with a shortfall on the same time axis – as many charts as there are roles with a shortfall.
7. Key figures as a table.
8. Data basis and limits; list there which of the four parts the report contains – it is all four, the pie chart from point 4 included.
Design: the same colour per role in the trend and the shares, roles by role number, consistent number formatting, every chart with a title and the period, business dashboard style, one part per page in print.
Reset the view to its previous state afterwards and do not save the project.
Output: Provide the complete management report as a downloadable PDF file in A4 landscape. Use readable charts, complete tables and clean page breaks; check that nothing is clipped before providing the file. Also give three key findings with figures from the report in the chat. If you cannot create a PDF, provide a print-ready HTML file instead and explain “Open in a browser → Print → Save as PDF”. If you cannot provide a file, output the complete HTML code and state that limitation. Link only to files you have actually created.In your words
- Half year: Give me the capacity report per role for our portfolio from December to May, in hours, trend per week.
- Single project: How is the effort of this project spread across the roles next quarter, and is the supply per role enough?
- Staffing talk: Which role carries the largest share of the effort, and in which week does it get tightest?
What you need
- An open project or portfolio whose tasks carry job roles, and a resource pool with people in these roles.
- Answers to the AI’s questions: scope, period, time unit and the time scale for the trend.
- Read-only mode is not enough: the AI switches view, time filter and time scale twice – one undo step each; business data stays untouched, and at the end it resets the view.
- An AI client that can draw charts. Rillsoft Project supplies the figures.
What you get
A report of four charts with short texts, all for the same period. In the test portfolio Steel and facade construction (five projects, eleven roles), 1 Dec 2026 to 31 May 2027, in hours, trend per week: 16,688 hours of demand stand against 41,152 hours of supply, the roles are 41 % utilised in total.
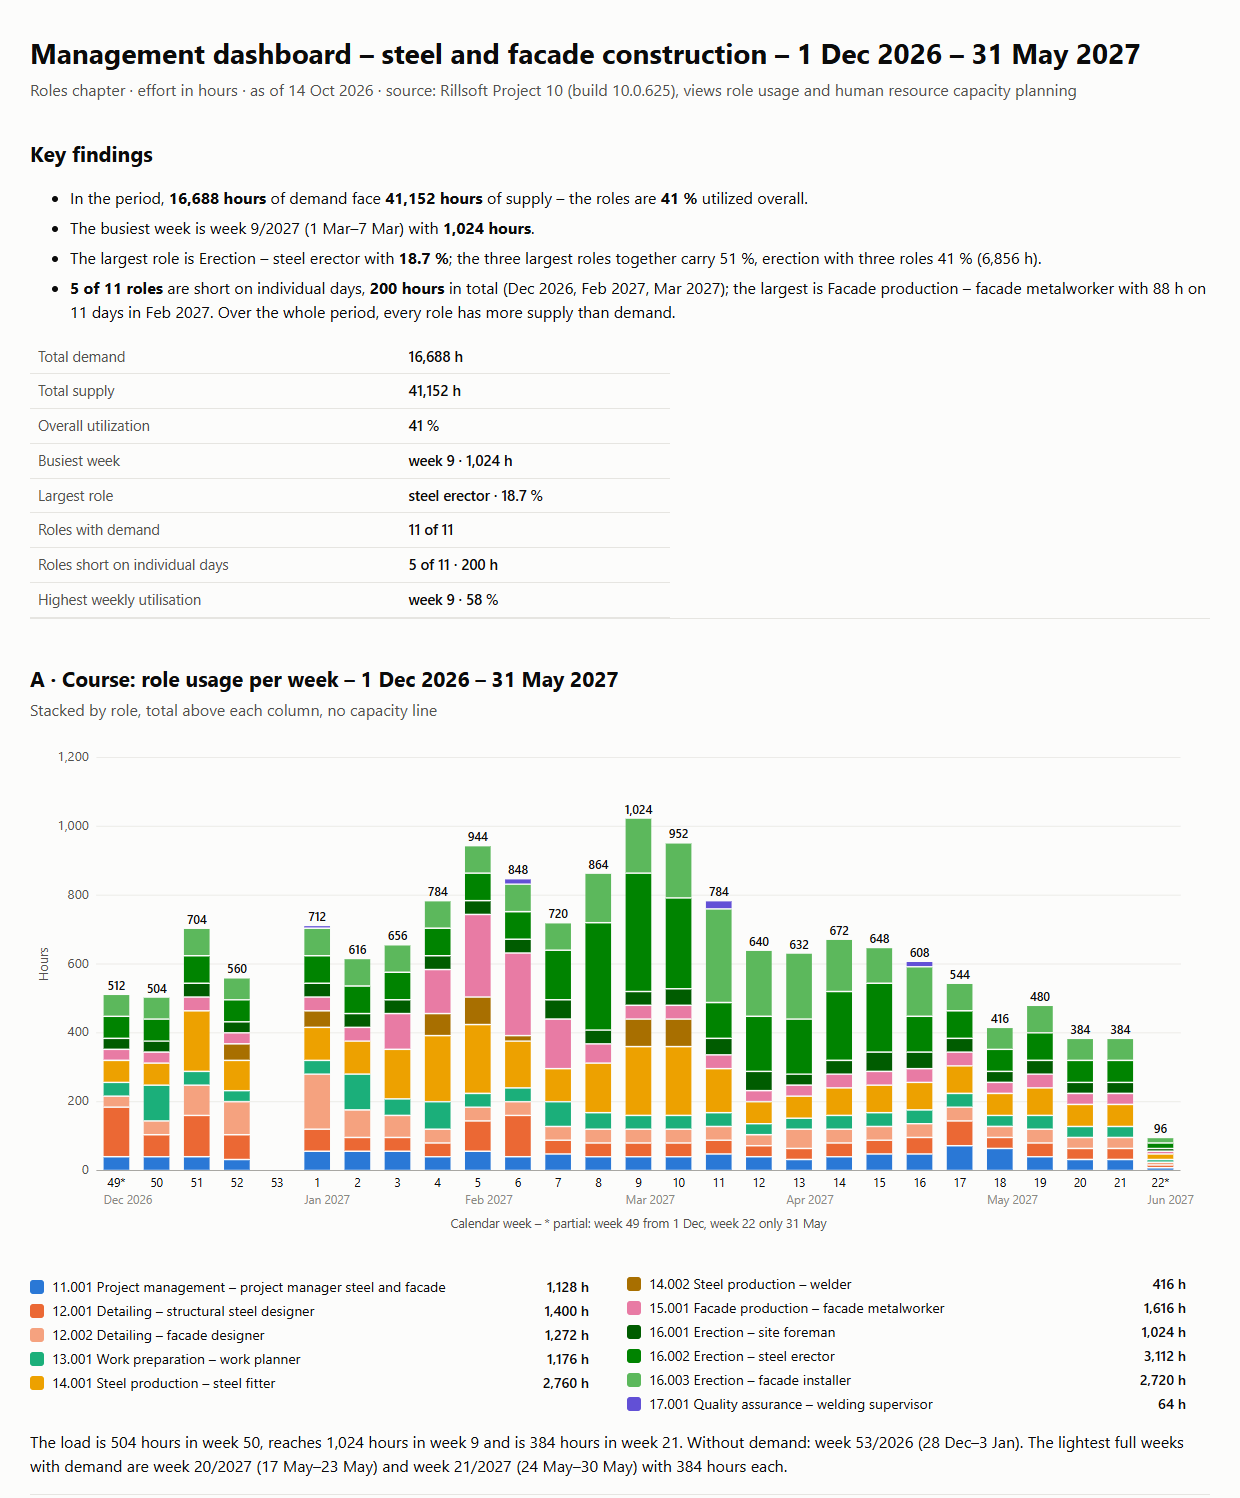
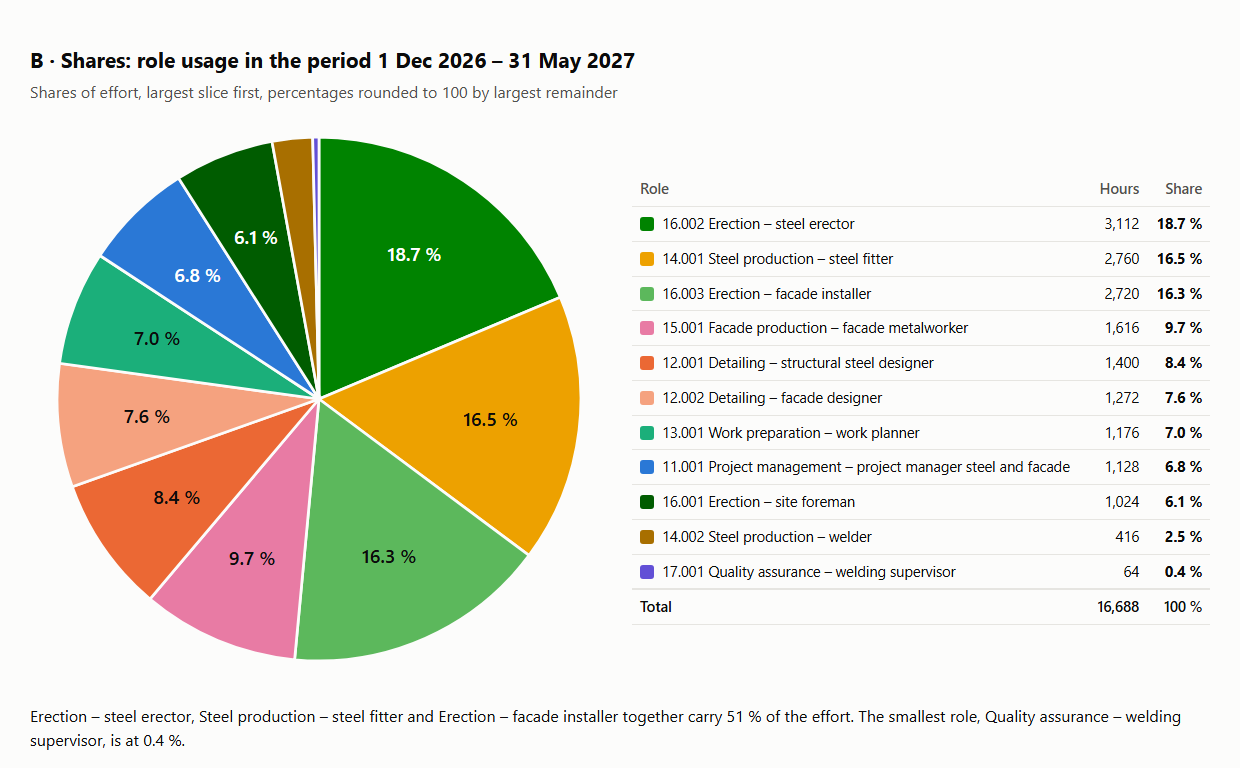
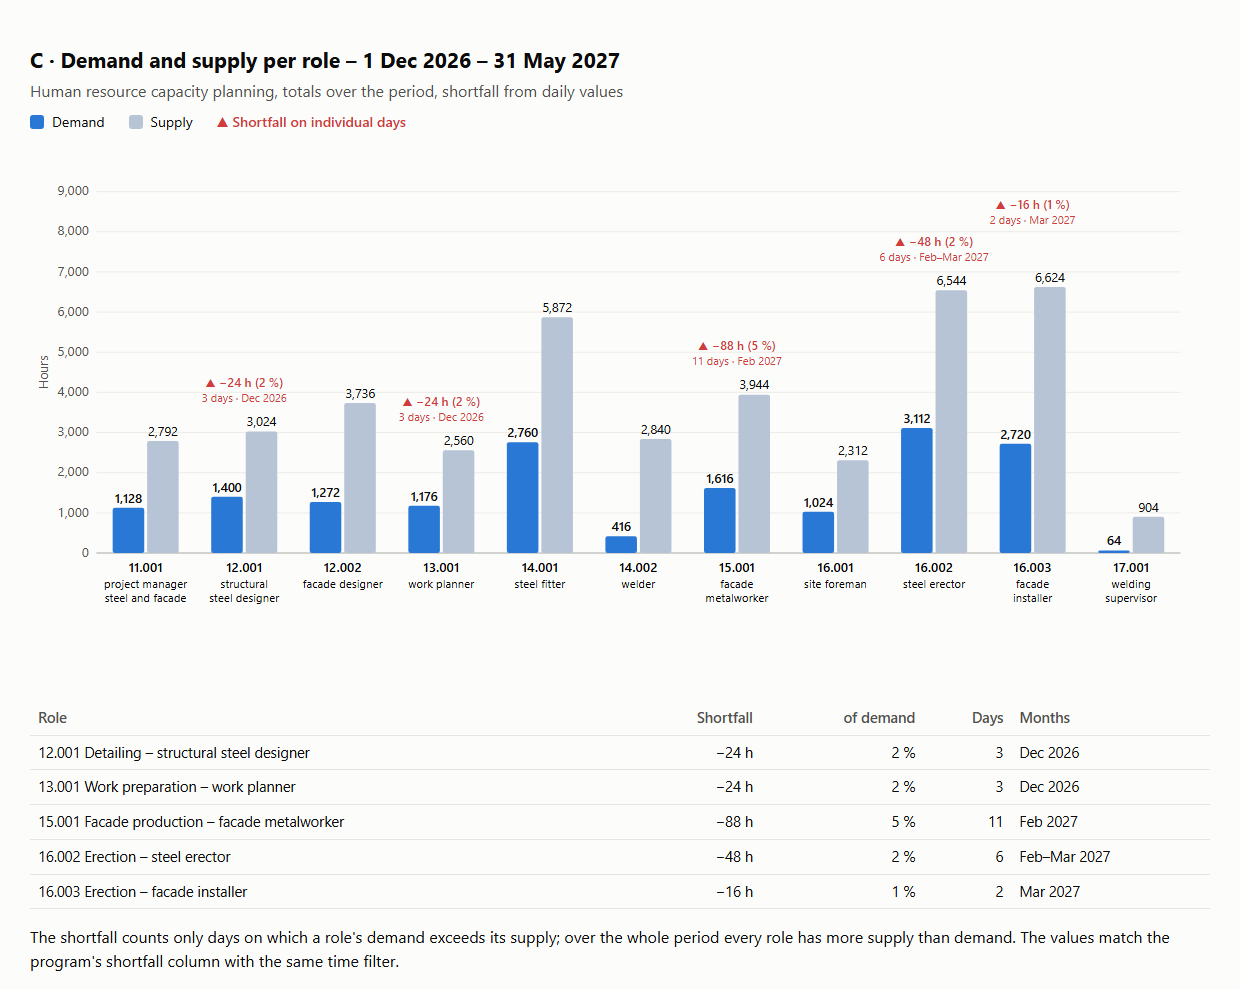
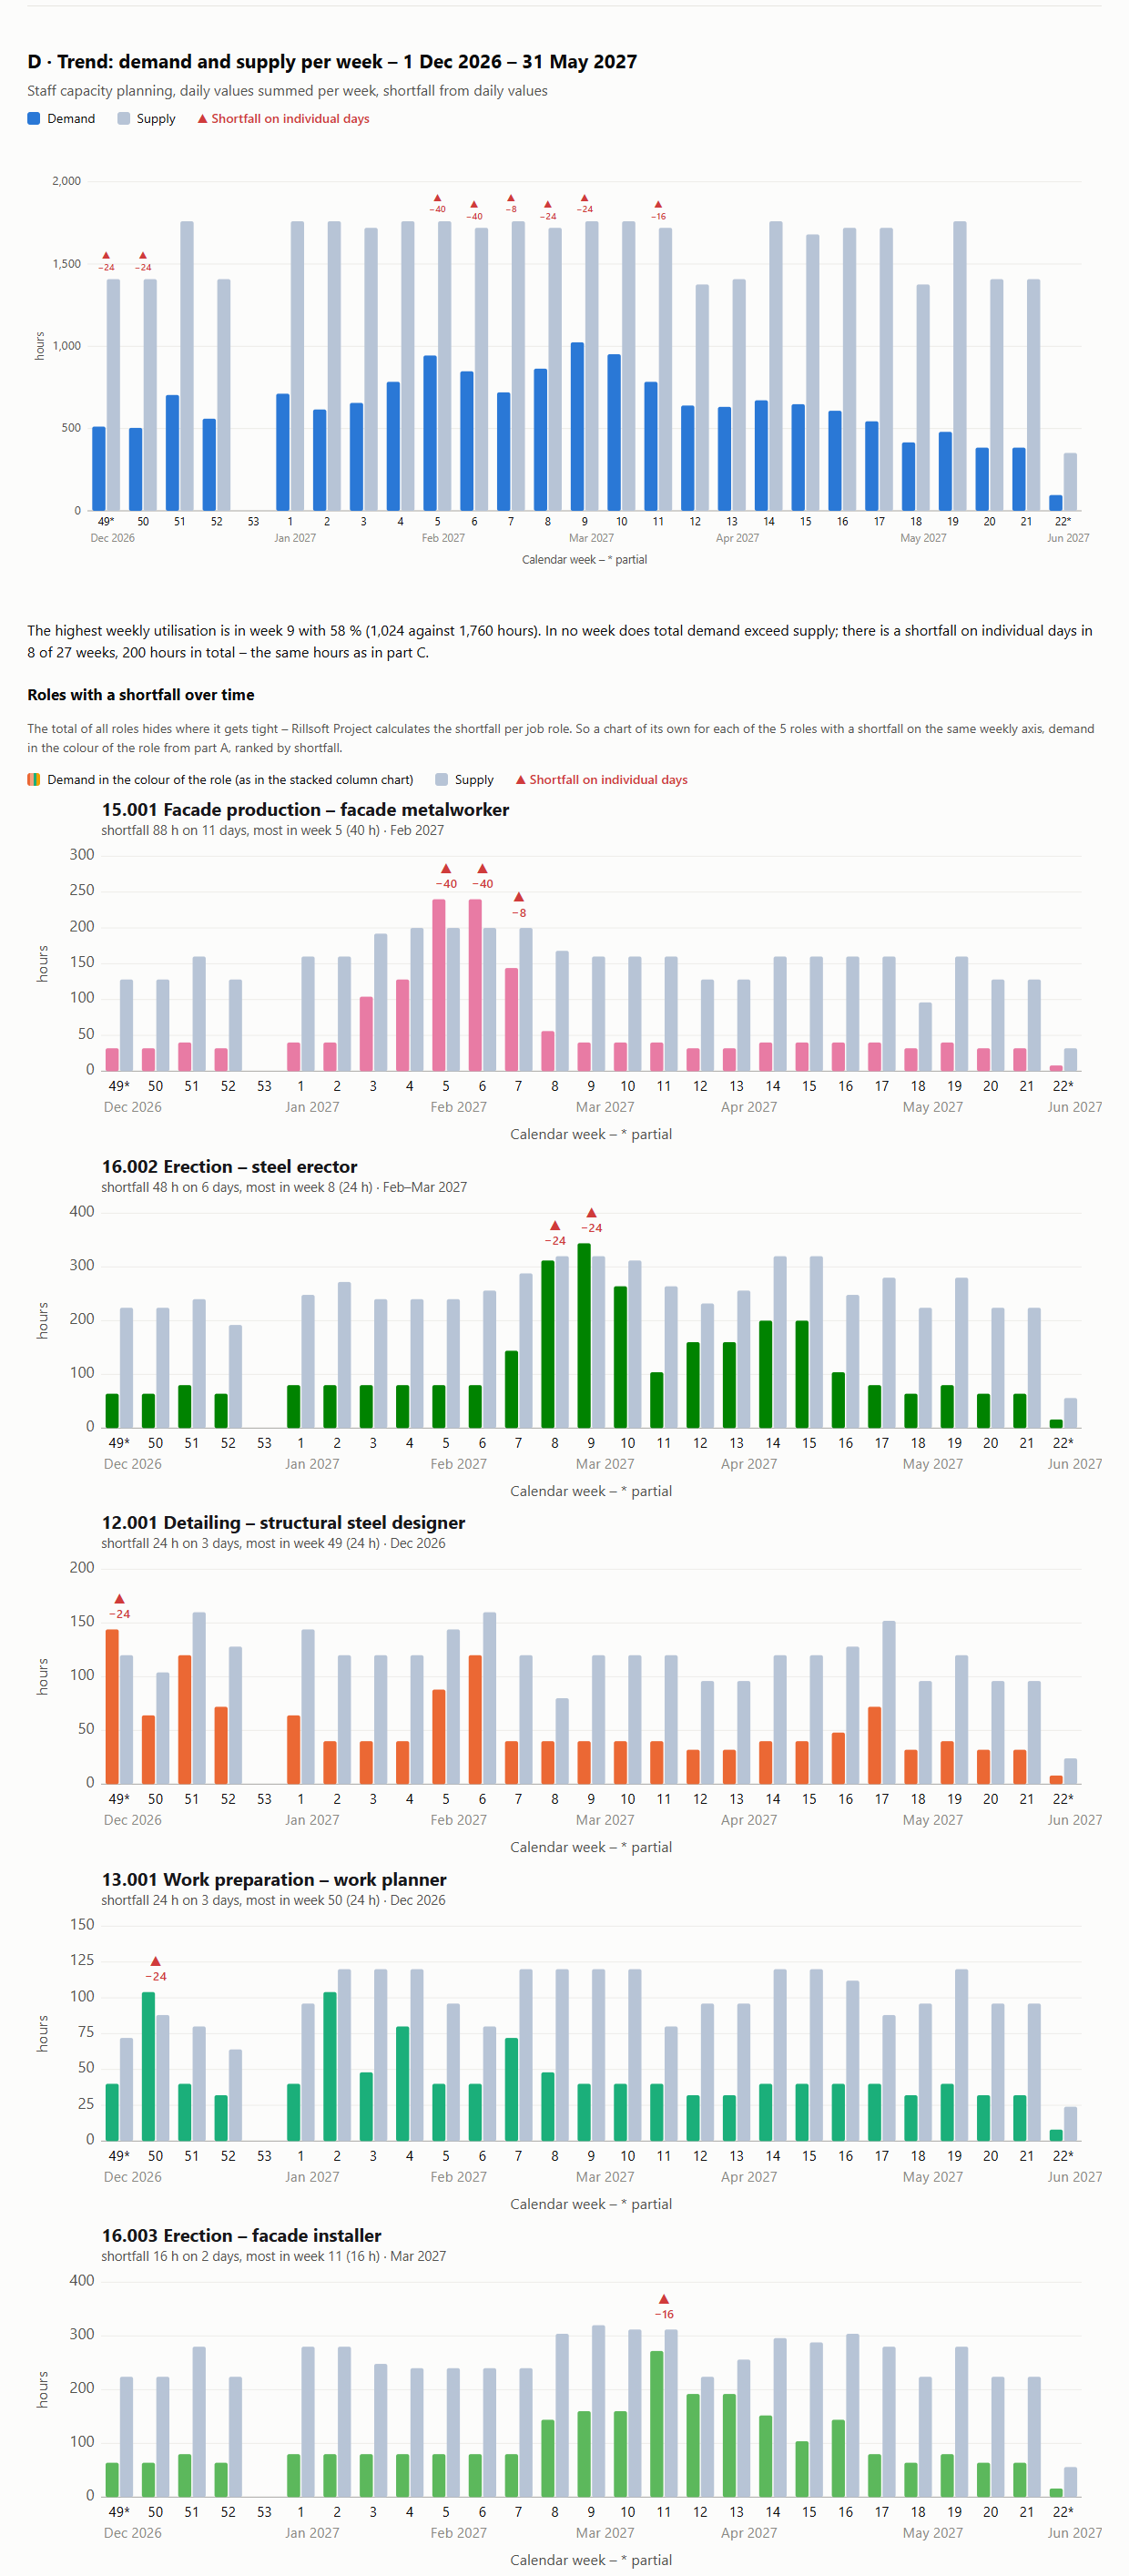
Part A shows the trend per week – the load rises to 1,024 hours in week 9/2027 and falls to 384 by May; in week 53/2026 there is no demand. Part B shows the shares: Assembly – steel fitter carries 18.7 %, the three largest roles 51 % together, the smallest 0.4 %. Part C puts demand and supply per role side by side: in total the supply is enough for every role, yet on individual days 200 hours are missing across 5 of 11 roles – most of all Facade production – facade metalworker with 88 hours on 11 days in February 2027. Part D shows the same demand and supply per week; in no week is demand above supply in total, and below it every role with a shortfall has a chart of its own.
Why it is useful
Four questions about the roles in one document: how does the load run, which role carries which share, is the supply per role enough, and when does it get tight? There are separate prompts for each; this one brings them together with one period and reconciled totals, so the four pictures fit each other. It is the same chapter that the management dashboard offers as the roles chapter – here on its own, without the other chapters.How the answer is produced
The AI reads two views: role utilisation in the chosen time scale for parts A and B, and the staff capacity comparison per role at day scale for part C; part D sums the same daily values per interval. Before drawing, it checks that total effort and effort per role are the same in both views – if they differ, it names the difference instead of the report. For each chart the rule of its own prompt applies: role utilisation as a stacked chart for part A and demand and supply over time for part D.rillsoft_view_state_get rillsoft_view_state_apply rillsoft_timescale_apply rillsoft_analysis_report_get
Limits
The report describes roles, not people; supply counts qualification capacity, not heads. People with two roles have shared capacity. Compare with the program view only with the same time filter. FTE exists for demand only, not for supply. If you also need traffic lights, dates or costs, take the management dashboard and choose further chapters there; all 22 questions are in the catalogue. The product page of Rillsoft Project describes capacity planning. Related prompts:Try it
Get started- Industry package
Stahl- und Fassadenbau.rpp (test portfolio)- Product version
- Rillsoft Project 10 (Build 10.0.625)
- Last verified
- 2026-10-19
- Verification
- Figures and statements verified on the named sample package against the named product build – MCP session, view and report; German and English package with identical figures.