All people, companies and projects shown are synthetic Rillsoft sample data – from the shipped industry packages or, where stated, from a test project.
The prompt
Which critical developments are emerging in the coming period? Read the milestones in the period with their status in Rillsoft Project (reached, holds, moves with new date and working days, planned date) and the capacity comparison per role on the day scale, and put both per week on one timeline: milestones, moving commitments, shortfall in hours and roles, type of week. Name the tightest week and the longest bottleneck phase per role. First ask me for project or portfolio, period and time scale; the reference date is the status date. No forecast – only the plan at the reference date. Reset the view afterwards and change nothing.Read-only mode is enough
Show the detailed prompt
Create a timeline of the critical developments in the coming period from Rillsoft Project.
First ask me for:
- Scope: project or portfolio (name the open one and let me confirm),
- Period: start and end (if I give none, suggest the project period),
- Time scale: week or month (suggest one with at most about 30 intervals),
- Unit: name the one set in the project,
- Thresholds: amber up to 5, red above 5 working days of shift – ask whether they apply.
The reference date is the status date; name it.
Data in one pass, read-only:
- Project structure with float: every milestone in the period with its status from the program – before the reference date reached or overdue, from the reference date holds or moves (negative start float, new date and working days by the project calendar), not fixed as planned date.
- Staff capacity comparison per role, absolute values with capacity, time filter on the period, time scale day: shortfall per role and day as max(0, demand − supply), summed per week; the ten largest cells role × week; per role the longest sequence of weeks with a shortfall.
- Per week the type: commitment moves, milestone and bottleneck, bottleneck, milestone, quiet.
- Calculate no forecast; reset the view and the time scale and change nothing.
Report:
1. Header with scope, reference date, period, time scale, unit and source.
2. Key findings with figures: milestones and moving commitments with week and dates; weeks with a bottleneck, total shortfall, tightest week; longest bottleneck phase; weeks with milestone and bottleneck; quiet weeks; the note “no forecast”.
3. Timeline per week: milestones in their status colour at the top, shortfall as columns below, the type of week underneath; legends.
4. Table per week: milestones, moving commitments, shortfall, roles, type.
5. Table of the bottleneck phases per role.
6. Data and rules.In your words
- Quarter preview: What is coming up in the first quarter of 2027? Milestones and bottlenecks per week on a timeline, with the weeks in which both coincide.
- Next eight weeks: Show me the next eight weeks from the reference date: which commitments move, where is capacity missing, which week is the tightest?
- By month: The same timeline by month instead of week, for the whole portfolio up to the project end.
What you need
- An open project or portfolio with milestones, roles with people in the resource pool, maintained actual progress and a set status date.
- Committed dates as fixed milestones; float switched on in the program.
- Read-only mode is enough: the AI reads project structure, calendars, conflict list and capacity comparison, resets the view and changes nothing.
What you get
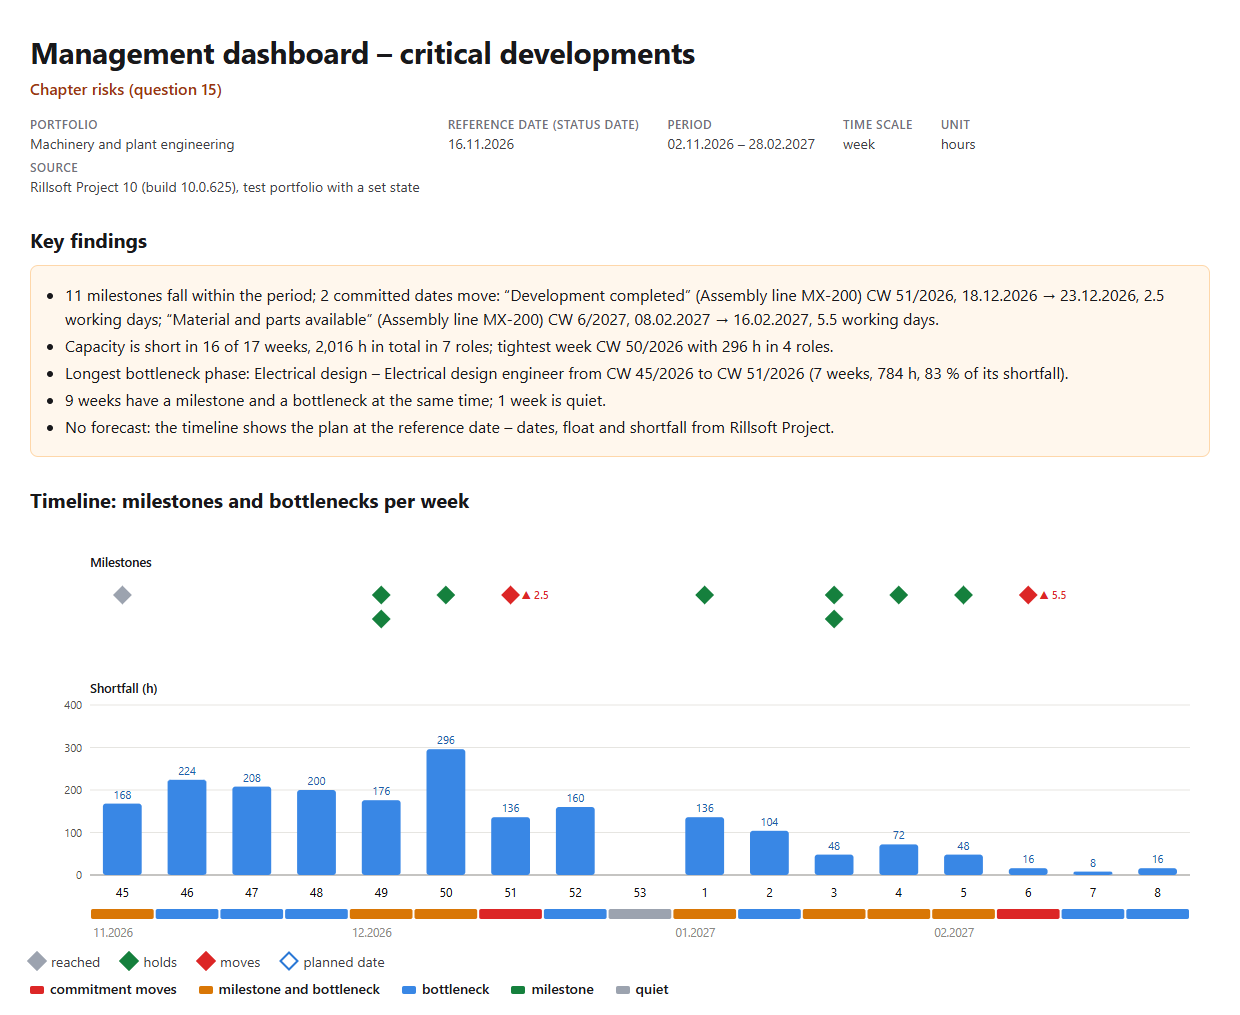
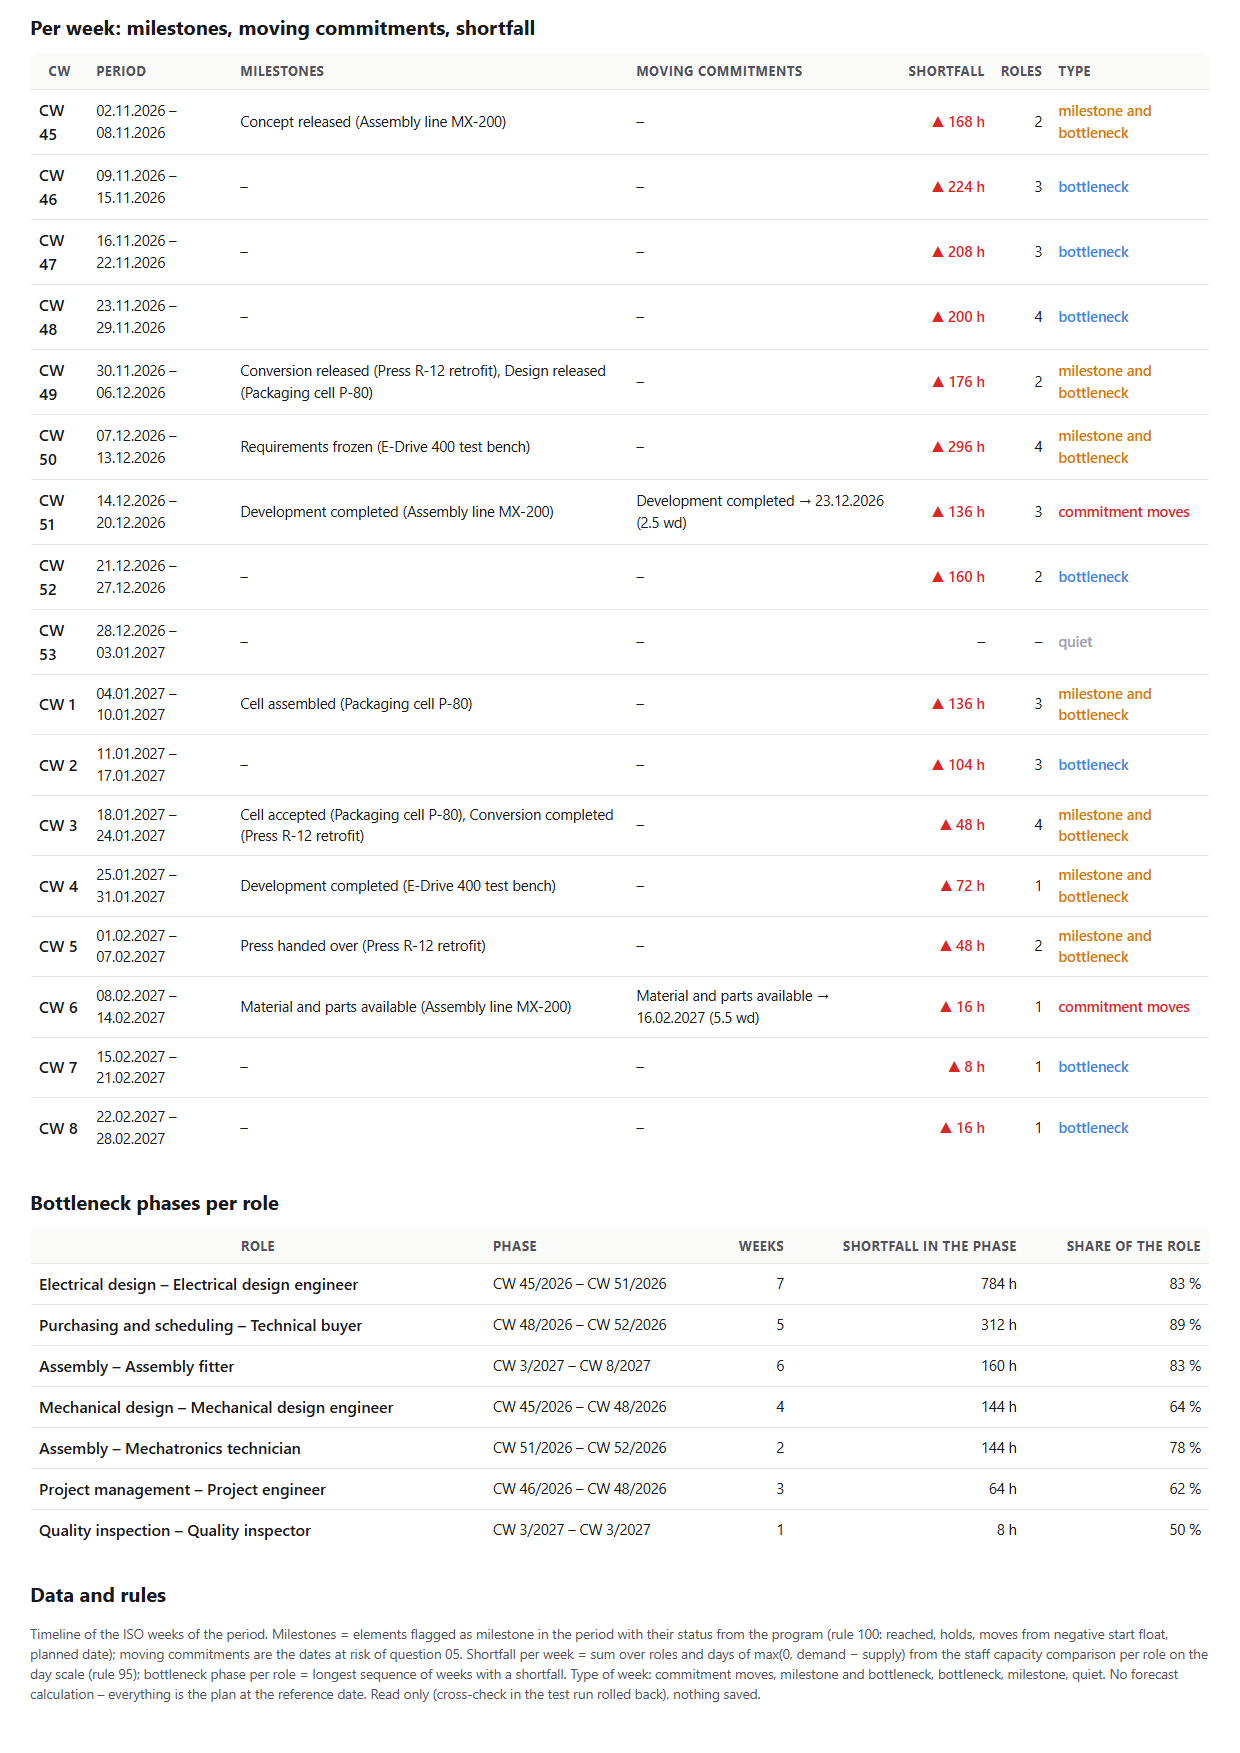
A timeline with key findings, two tables and the bottleneck phases. In the test portfolio Machinery and plant engineering (five projects, status date 16 Nov 2026 and a backlog in two projects set for the test) eleven milestones fall between 2 Nov 2026 and 28 Feb 2027; two committed dates move, both in Assembly line MX-200: “Development completed” in CW 51 from 18 Dec to 23 Dec 2026 (2.5 working days) and “Material and parts available” in CW 6 from 8 Feb to 16 Feb 2027 (5.5 working days). Capacity is short in 16 of 17 weeks, 2,016 hours in total in seven roles; the tightest week is CW 50/2026 with 296 hours in four roles.
The longest bottleneck phase is Electrical design from CW 45 to 51/2026 with 784 hours, 83 percent of its shortfall. Nine weeks have a milestone and a bottleneck at the same time, one week is quiet. The timeline shows the milestones in their status colour at the top, the shortfall per week below and the type of each week as a colour bar – all from the plan at the reference date, without forecast.
Why it is useful
Management wants to know what comes together in the next weeks: which dates are due or move and where capacity is missing at the same time. Both are in Rillsoft Project, but in different views. The AI puts milestones, moving commitments and shortfall per week on one timeline and names the weeks in which it gets crowded – without forecasting, only from the plan at the reference date.How the answer is produced
In one pass the AI reads the project structure with float, calendars and conflict list for the milestones with status and the capacity comparison per role on the day scale for the shortfall per role and day. Per ISO week of the period it summarises milestones, moving commitments and the sum of the shortfall, determines the type of week, the ten largest cells role by week and per role the longest bottleneck phase. In the test run milestones and moving commitments matched the prompts Milestones in the period and Delivery dates at risk, the shortfall and the bottleneck phase the prompts Overloaded roles and Largest bottlenecks.rillsoft_project_tree_get rillsoft_calendar_list rillsoft_project_conflict_list rillsoft_view_state_get rillsoft_view_state_apply rillsoft_timescale_apply rillsoft_analysis_report_get
Limits
No forecast: the timeline shows the plan at the reference date, no probabilities and no extrapolation. The type of week summarises facts and does not rate. A moving commitment stands in the week of its old date. The question belongs to the catalogue of management questions; the single views are given by the prompts Milestones in the period, Delivery dates at risk and Largest bottlenecks. The product page of Rillsoft Project describes milestones and the capacity comparison. Related prompts:Try it
Get started- Industry package
Machinery and plant engineering.rpp- Product version
- Rillsoft Project 10 (Build 10.0.625)
- Last verified
- 2026-10-17
- Verification
- Figures and statements verified on the named sample package against the named product build – MCP session, view and report; German and English package with identical figures.