All people, companies and projects shown are synthetic Rillsoft sample data – from the shipped industry packages or, where stated, from a test project.
The prompt
Which schedule shifts affect other projects? Read the conflict list of cross-project dependencies and the staff capacity comparison per role and per role and project on the day scale in Rillsoft Project. On bottleneck days of a role (demand above supply) a shift hits every other project that needs the role on these days: give per project pair the shared bottleneck role-days and the shortfall of these days as a matrix, per project the shared roles and the strongest coupling, per role the projects on bottleneck days. First ask me for portfolio, period and unit; the reference date is the status date. Do not calculate the effect of a concrete shift – only the program shows that by executing and undoing. Reset the view afterwards and save nothing.Read-only mode is enough
Show the detailed prompt
Create a cross-project conflict overview from Rillsoft Project.
First ask me for:
- Scope: portfolio (name the open one and let me confirm),
- Period: start and end (if I give none, suggest the project period),
- Unit: name the one set in the project.
The reference date is the status date; name it.
Data, read-only:
- Conflict list “cross-project dependencies”: empty in a file portfolio, they exist only in a server portfolio – name the result.
- Staff capacity comparison per role, absolute values with capacity, time filter on the period, time scale day: bottleneck day = demand above supply.
- The same comparison per role and project: demand per role, project and day (the supply there is the assignment, do not use it).
- Coupling per project pair: role-days (role and bottleneck day) on which both projects have demand, and the shortfall of the role on these days. Per project: roles in total, shared with others, bottleneck roles, demand and demand on bottleneck days, coupling per other project. Per role: projects with demand, of which on bottleneck days, bottleneck days, highest number of projects on one day.
- Do not calculate the effect of a concrete shift; reset the view and the time scale and save nothing.
Report:
1. Header with scope, reference date, period, unit and source.
2. Key findings with figures: dependencies, shared roles, bottleneck role-days with several projects, strongest and weakest project pair, the project with the most role-days; the note that only the program shows the effect of a concrete shift.
3. Coupling matrix project × project with role-days and hours.
4. Table per project: roles, shared, bottleneck roles, demand, on bottleneck days, strongest coupling, role-days in total.
5. Table per role: projects, on bottleneck days, bottleneck days, highest number of projects on one day, shortfall.
6. Result of the conflict list and note on the server portfolio.
7. Data and rules.In your words
- Before a shift: If Assembly line MX-200 slips by two weeks – which projects does that hit through shared roles, and on which bottleneck days?
- Portfolio meeting: Which project pairs are most tightly linked? Coupling matrix through shared roles on bottleneck days in the first quarter of 2027.
- Server portfolio: Are there cross-project dependencies in the portfolio? List them with predecessor and successor – and add the coupling through roles.
What you need
- An open portfolio with several projects, roles in the resource pool and people per role; demand through role assignments of the tasks.
- Cross-project dependencies exist only in a server portfolio (Rillsoft Integration Server); in a file portfolio the path through shared roles remains.
- Read-only mode is enough: the AI reads the conflict list and the capacity comparison, resets the view and saves nothing.
What you get
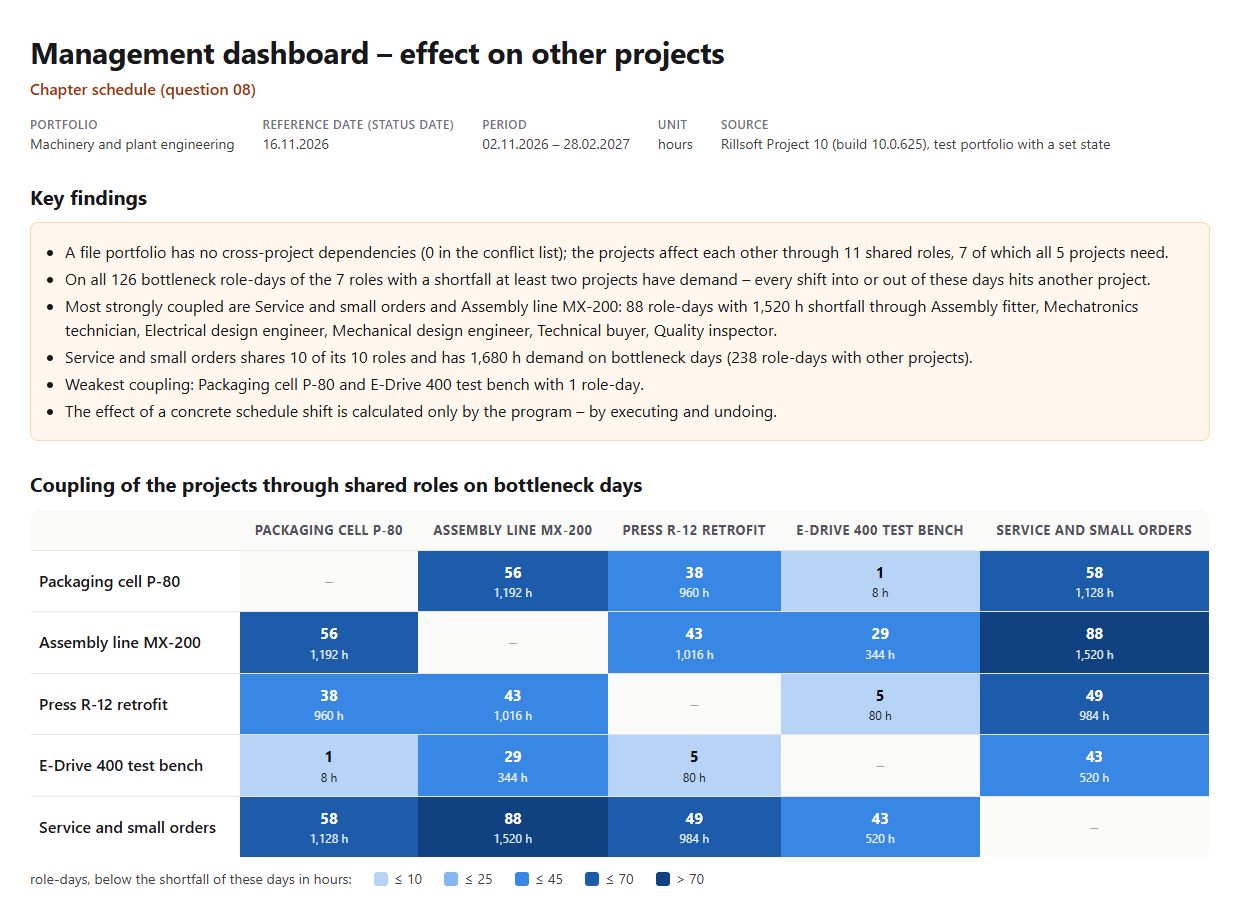
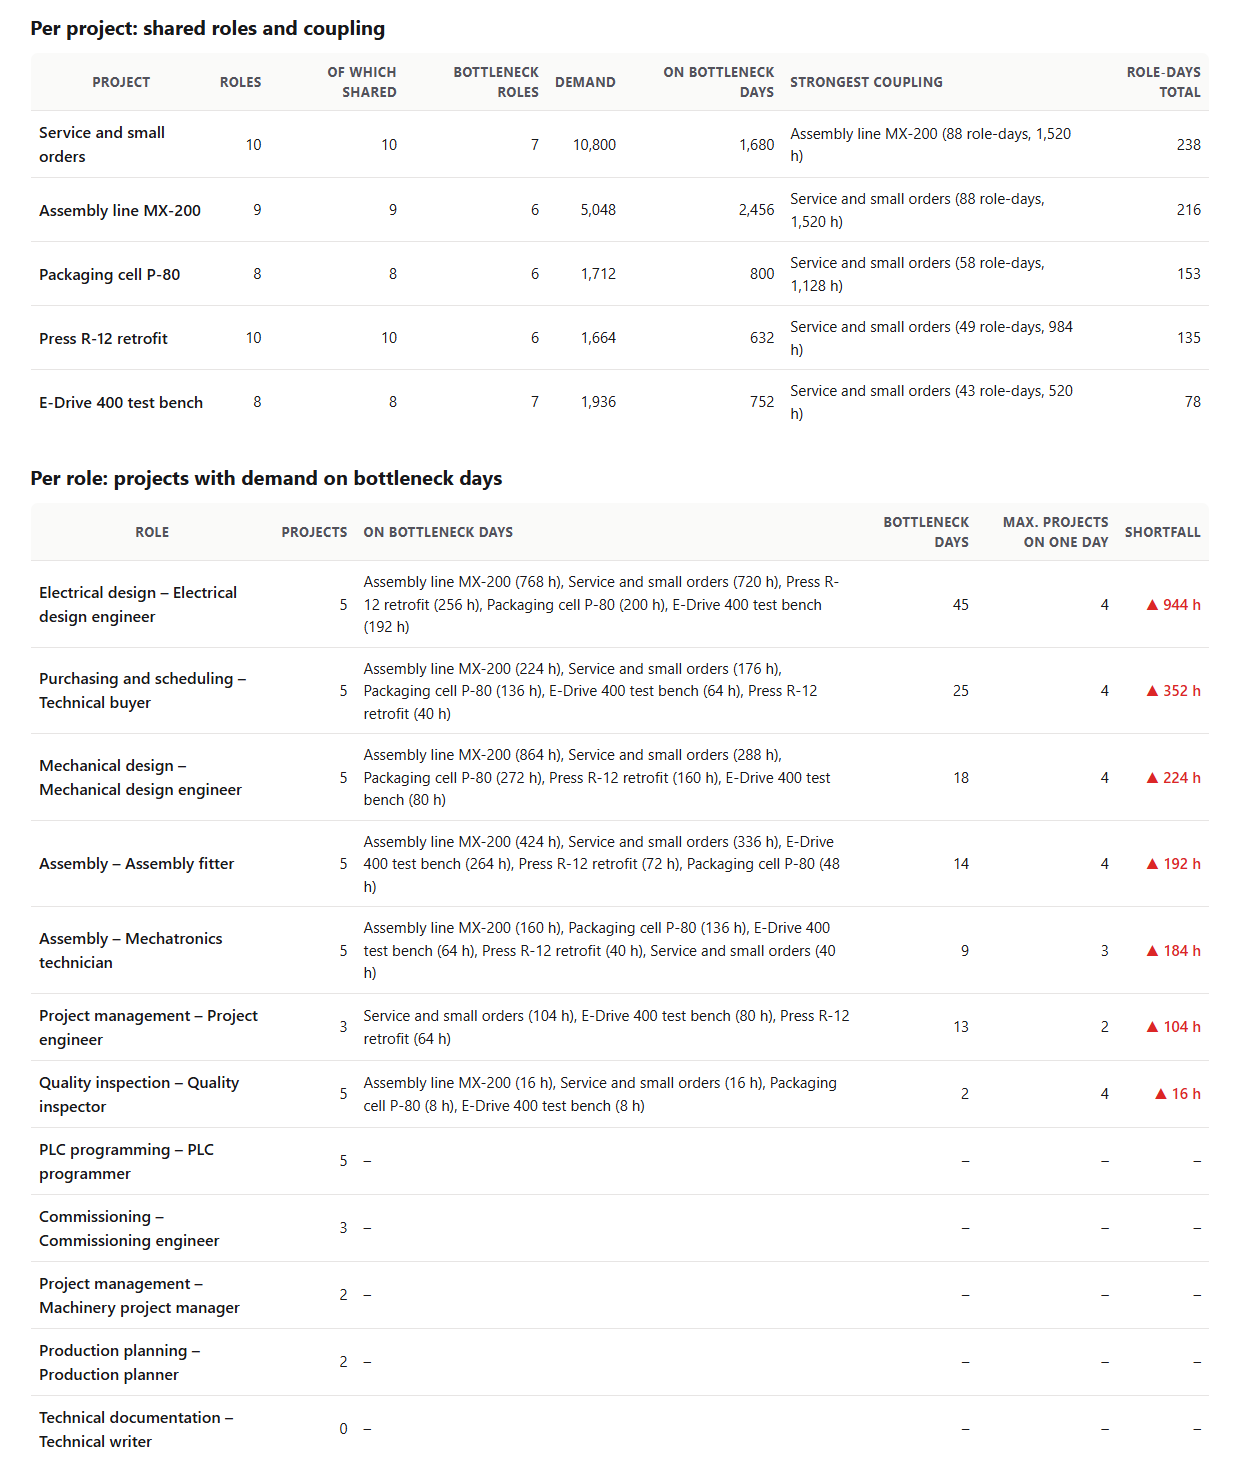
An overview with key findings, the coupling matrix and tables per project and per role. In the test portfolio Machinery and plant engineering (five projects, status date 16 Nov 2026 and a backlog in two projects set for the test) there are no cross-project dependencies, because it is a file portfolio; the projects affect each other through eleven shared roles, seven of which all five projects need. On all 126 bottleneck role-days of the seven roles with a shortfall between 2 Nov 2026 and 28 Feb 2027 at least two projects have demand – every shift into or out of these days hits another project.
Most strongly coupled are Service and small orders and Assembly line MX-200 with 88 role-days and 1,520 hours of shortfall through six roles; weakest Packaging cell P-80 and E-Drive 400 test bench with one role-day. Service and small orders shares all ten of its roles and has 238 role-days with other projects. The matrix says who hits whom; by how many hours the shortfall changes for a particular shift is shown only by the program after rescheduling.
Why it is useful
Before a project is shifted, management wants to know whom that hits. In a portfolio the projects are linked through dependencies and through shared roles; Rillsoft Project calculates the bottleneck days per role and knows the demand per project on these days. The AI turns that into a coupling matrix project against project and names the roles behind it – without executing a shift.How the answer is produced
The AI remembers the view, reads the conflict list of cross-project dependencies and the capacity comparison per role and per role and project on the day scale with a time filter; it resets the view. Per role it determines the bottleneck days and the projects with demand on these days; per project pair it counts the role-days on which both have demand and sums the shortfall of these days. From that it builds the matrix and the tables per project and per role. In the test run the figures matched the resource conflict matrix and the feasibility check, and the matrix was symmetric.rillsoft_view_state_get rillsoft_project_tree_get rillsoft_project_conflict_list rillsoft_view_state_apply rillsoft_timescale_apply rillsoft_analysis_report_get
Limits
Partly answered: cross-project dependencies exist only in a server portfolio, which is not tested; in a file portfolio the effect through shared roles remains. The coupling says which projects hang on the same bottleneck role-days, not by how much the shortfall changes for a particular shift – that is shown by the prompt Capacity after rescheduling through executing and undoing. The question belongs to the catalogue of management questions; the same calculation per role and project is shown by the resource conflict matrix. The product page of Rillsoft Project describes portfolios. Related prompts:Try it
Get started- Industry package
Machinery and plant engineering.rpp- Product version
- Rillsoft Project 10 (Build 10.0.625)
- Last verified
- 2026-10-17
- Verification
- Figures and statements verified on the named sample package against the named product build – MCP session, view and report; German and English package with identical figures.