All people, companies and projects shown are synthetic Rillsoft sample data – from the shipped industry packages or, where stated, from a test project.
The prompt
Which projects compete for the same roles, and who carries which part of the bottlenecks? Read the staff capacity comparison at day scale in Rillsoft Project, once per role and once per role and project. First ask me for portfolio, period and unit. On each bottleneck day of a role, spread the missing hours over the projects by their share of demand and show the result as a matrix role × project with totals, in one colour from light to dark.Changes the project (one undo step)
Show the detailed prompt
Create a resource conflict matrix from Rillsoft Project.
First ask me for:
- Scope: portfolio or selected projects (name the open one and let me confirm),
- Period: start and end (if I give none, suggest the next three months from the status date),
- Unit: hours or person-days (name the one set).
Data:
- Staff capacity comparison, absolute with capacity, time filter on the period, day scale: once flat by role, once by role and project.
- Bottleneck day of a role: demand above supply in the per-role report. Supply in the role-and-project report is the assignment – do not use it.
- Per role and project: demand on the bottleneck days and share of the shortfall – on each bottleneck day the role's missing hours times the project's share of demand, summed.
- Per role: competing projects, bottleneck days, of which days with at least two projects, highest number of projects on one day.
- Check that the shares per role add up to its shortfall; if not, name the difference instead of the matrix.
- Do not recalculate anything from the plan; no statements about people.
Report:
1. Header with scope, period, unit and source.
2. Three to five key findings with figures: how often projects compete on bottleneck days, which projects contribute most to the largest bottleneck, which project carries the largest share over all roles.
3. Matrix role × project: share in hours, below it the demand on bottleneck days, one colour from light to dark, row and column totals, legend.
4. Table of competition per role.
5. Data basis and rules.
Reset the view afterwards and save nothing.In your words
- Prioritisation: Which projects compete for electrical design, and which carries the largest part of the bottleneck?
- Portfolio review: Show me for the whole portfolio who competes for which roles on bottleneck days – as a matrix with hours.
- Two projects: Do MX-200 and the service business compete for the same people in December? Per role, please.
What you need
- An open portfolio with several projects whose tasks carry job roles, and a shared resource pool.
- Answers to the AI’s questions: scope, period and unit.
- An AI client that can draw coloured tables. Rillsoft Project supplies the figures.
- Read-only mode is not enough: the AI switches view, time filter and time scale – one undo step each; business data stays untouched, and at the end it resets the view.
What you get
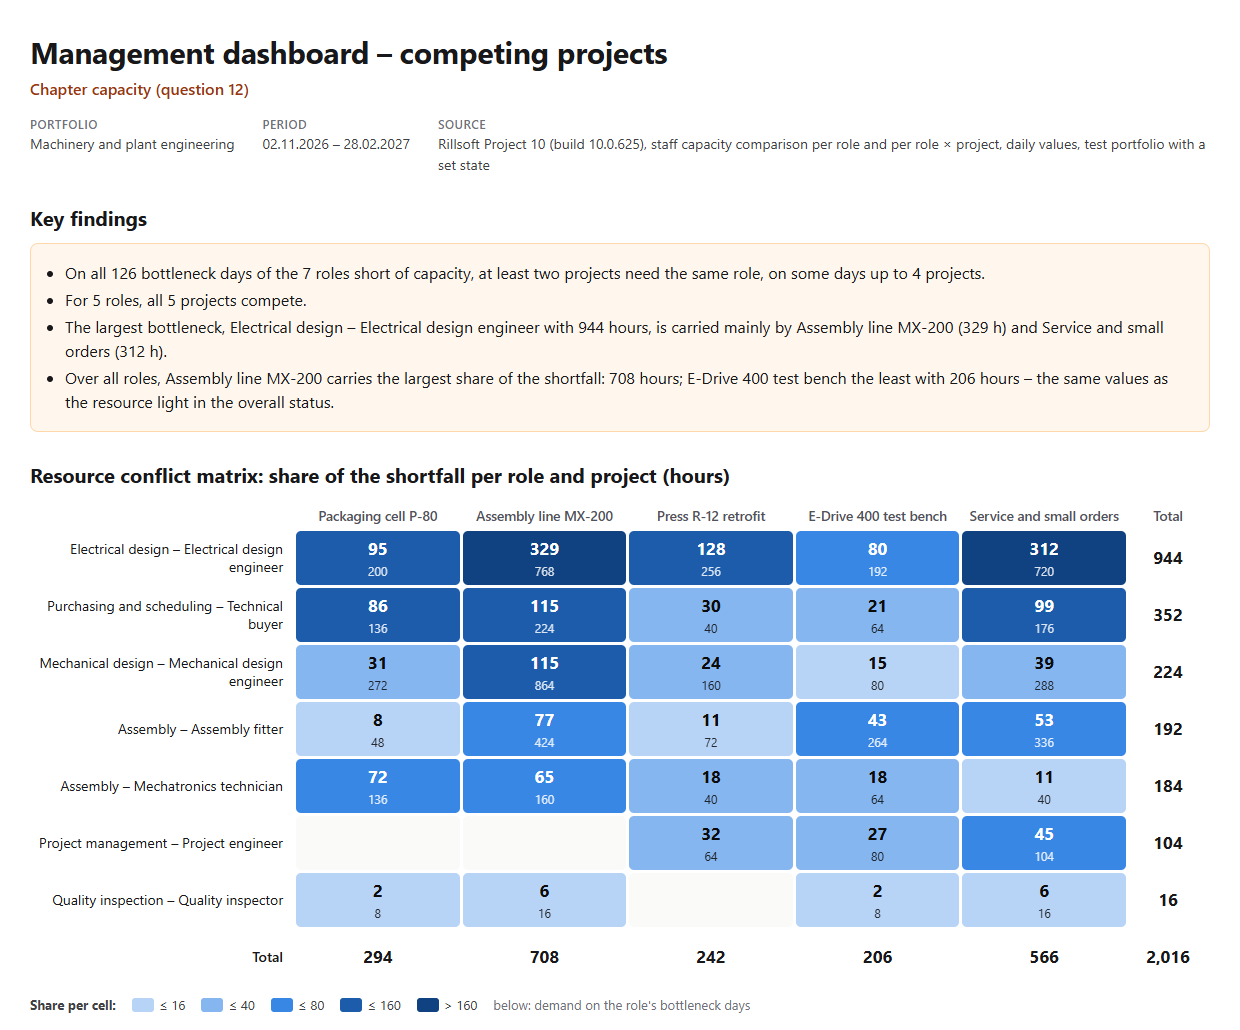
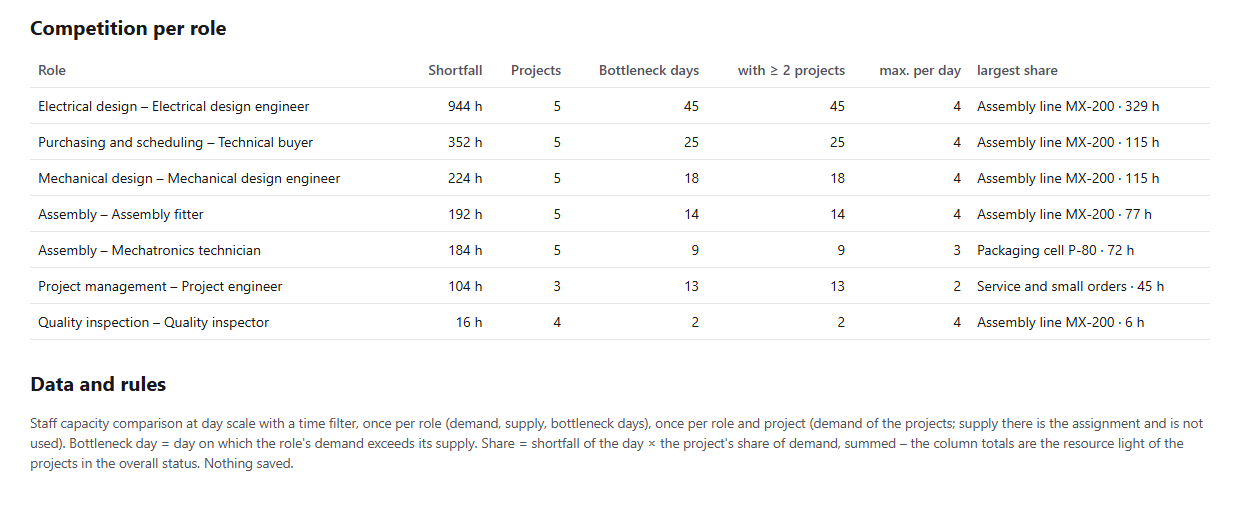
A matrix role × project, a table of competition per role and key findings. In the test portfolio Machinery and plant engineering (five projects, status date 16 Nov 2026 and a backlog in two projects set for the test), from November 2026 to February 2027 at least two projects need the same role on all 126 bottleneck days of the seven roles short of capacity, on some days up to four. For five roles, all five projects compete.
The largest bottleneck, Electrical design with 944 hours, is carried mainly by Assembly line MX-200 (329 hours) and Service and small orders (312). Over all roles, MX-200 carries the largest share with 708 hours, E-Drive 400 test bench the smallest with 206 – exactly the values of the resource light in the overall status. The row totals add up to the shortfall of the roles, 2,016 hours in total.
Why it is useful
A bottleneck rarely belongs to one project alone. For prioritisation, management needs to know which projects need the same role on the scarce days and how many of the missing hours fall on each. Rillsoft Project calculates demand and supply per role, project and day; the matrix spreads the shortfall traceably and so that it matches the resource light and the bottleneck overview.How the answer is produced
The AI reads the staff capacity comparison at day scale with a time filter twice: per role for demand, supply and bottleneck days, per role and project for the projects’ demand. On each bottleneck day it spreads the role’s missing hours by share of demand and sums per project. The rows are the shortfall from Which roles are overloaded?, the columns the resource light in the overall status.rillsoft_project_tree_get rillsoft_view_state_get rillsoft_view_state_apply rillsoft_timescale_apply rillsoft_analysis_report_get
Limits
Spreading by share of demand shows who has demand on the bottleneck days – it proves neither a cause nor a priority. The matrix describes roles, not people; supply counts qualification capacity. A single project has no competition between projects. The projects involved per qualification and period are named by the prompt Which projects compete for the same resources?; all 22 questions are in the catalogue. The product page of Rillsoft Project describes cross-project capacity planning. Related prompts:Try it
Get started- Industry package
Machinery and plant engineering.rpp- Product version
- Rillsoft Project 10 (Build 10.0.625)
- Last verified
- 2026-10-16
- Verification
- Figures and statements verified on the named sample package against the named product build – MCP session, view and report; German and English package with identical figures.